Metrics Collection in Spring Boot With Micrometer and Prometheus

Table of Content
- Introduction
- What is Prometheus ?
- Pre-requisite
- Bootstrapping application using Spring Initializer
- Project Structure
- Adding Micrometer Prometheus Registry
- Enabling Prometheus Endpoints
- Setup Prometheus using Docker
- Metrics Visualization in Prometheus Dashboard
- Micrometer Registry Customization
- Custom Metrics
Introduction
In this post, you’ll learn how to integrate your spring boot application with monitoring platform called Prometheus. We will collect application metrics using Micrometer and use Prometheus to store and visualize this data.
What is Prometheus ?
Prometheus is an open-source monitoring system that was originally built by SoundCloud. It consists of the following core components:
- A data scraper that pulls metrics data over HTTP periodically at a configured interval.
- A time-series database to store all the metrics data.
- A simple user interface where you can visualize, query and monitor all the metrics.
We will be using all of the above Prometheus components in this post.
Pre-requisite
- Java 1.8 or newer
- IntelliJ or Eclipse IDE
- Docker
Bootstrapping application using Spring Initializer
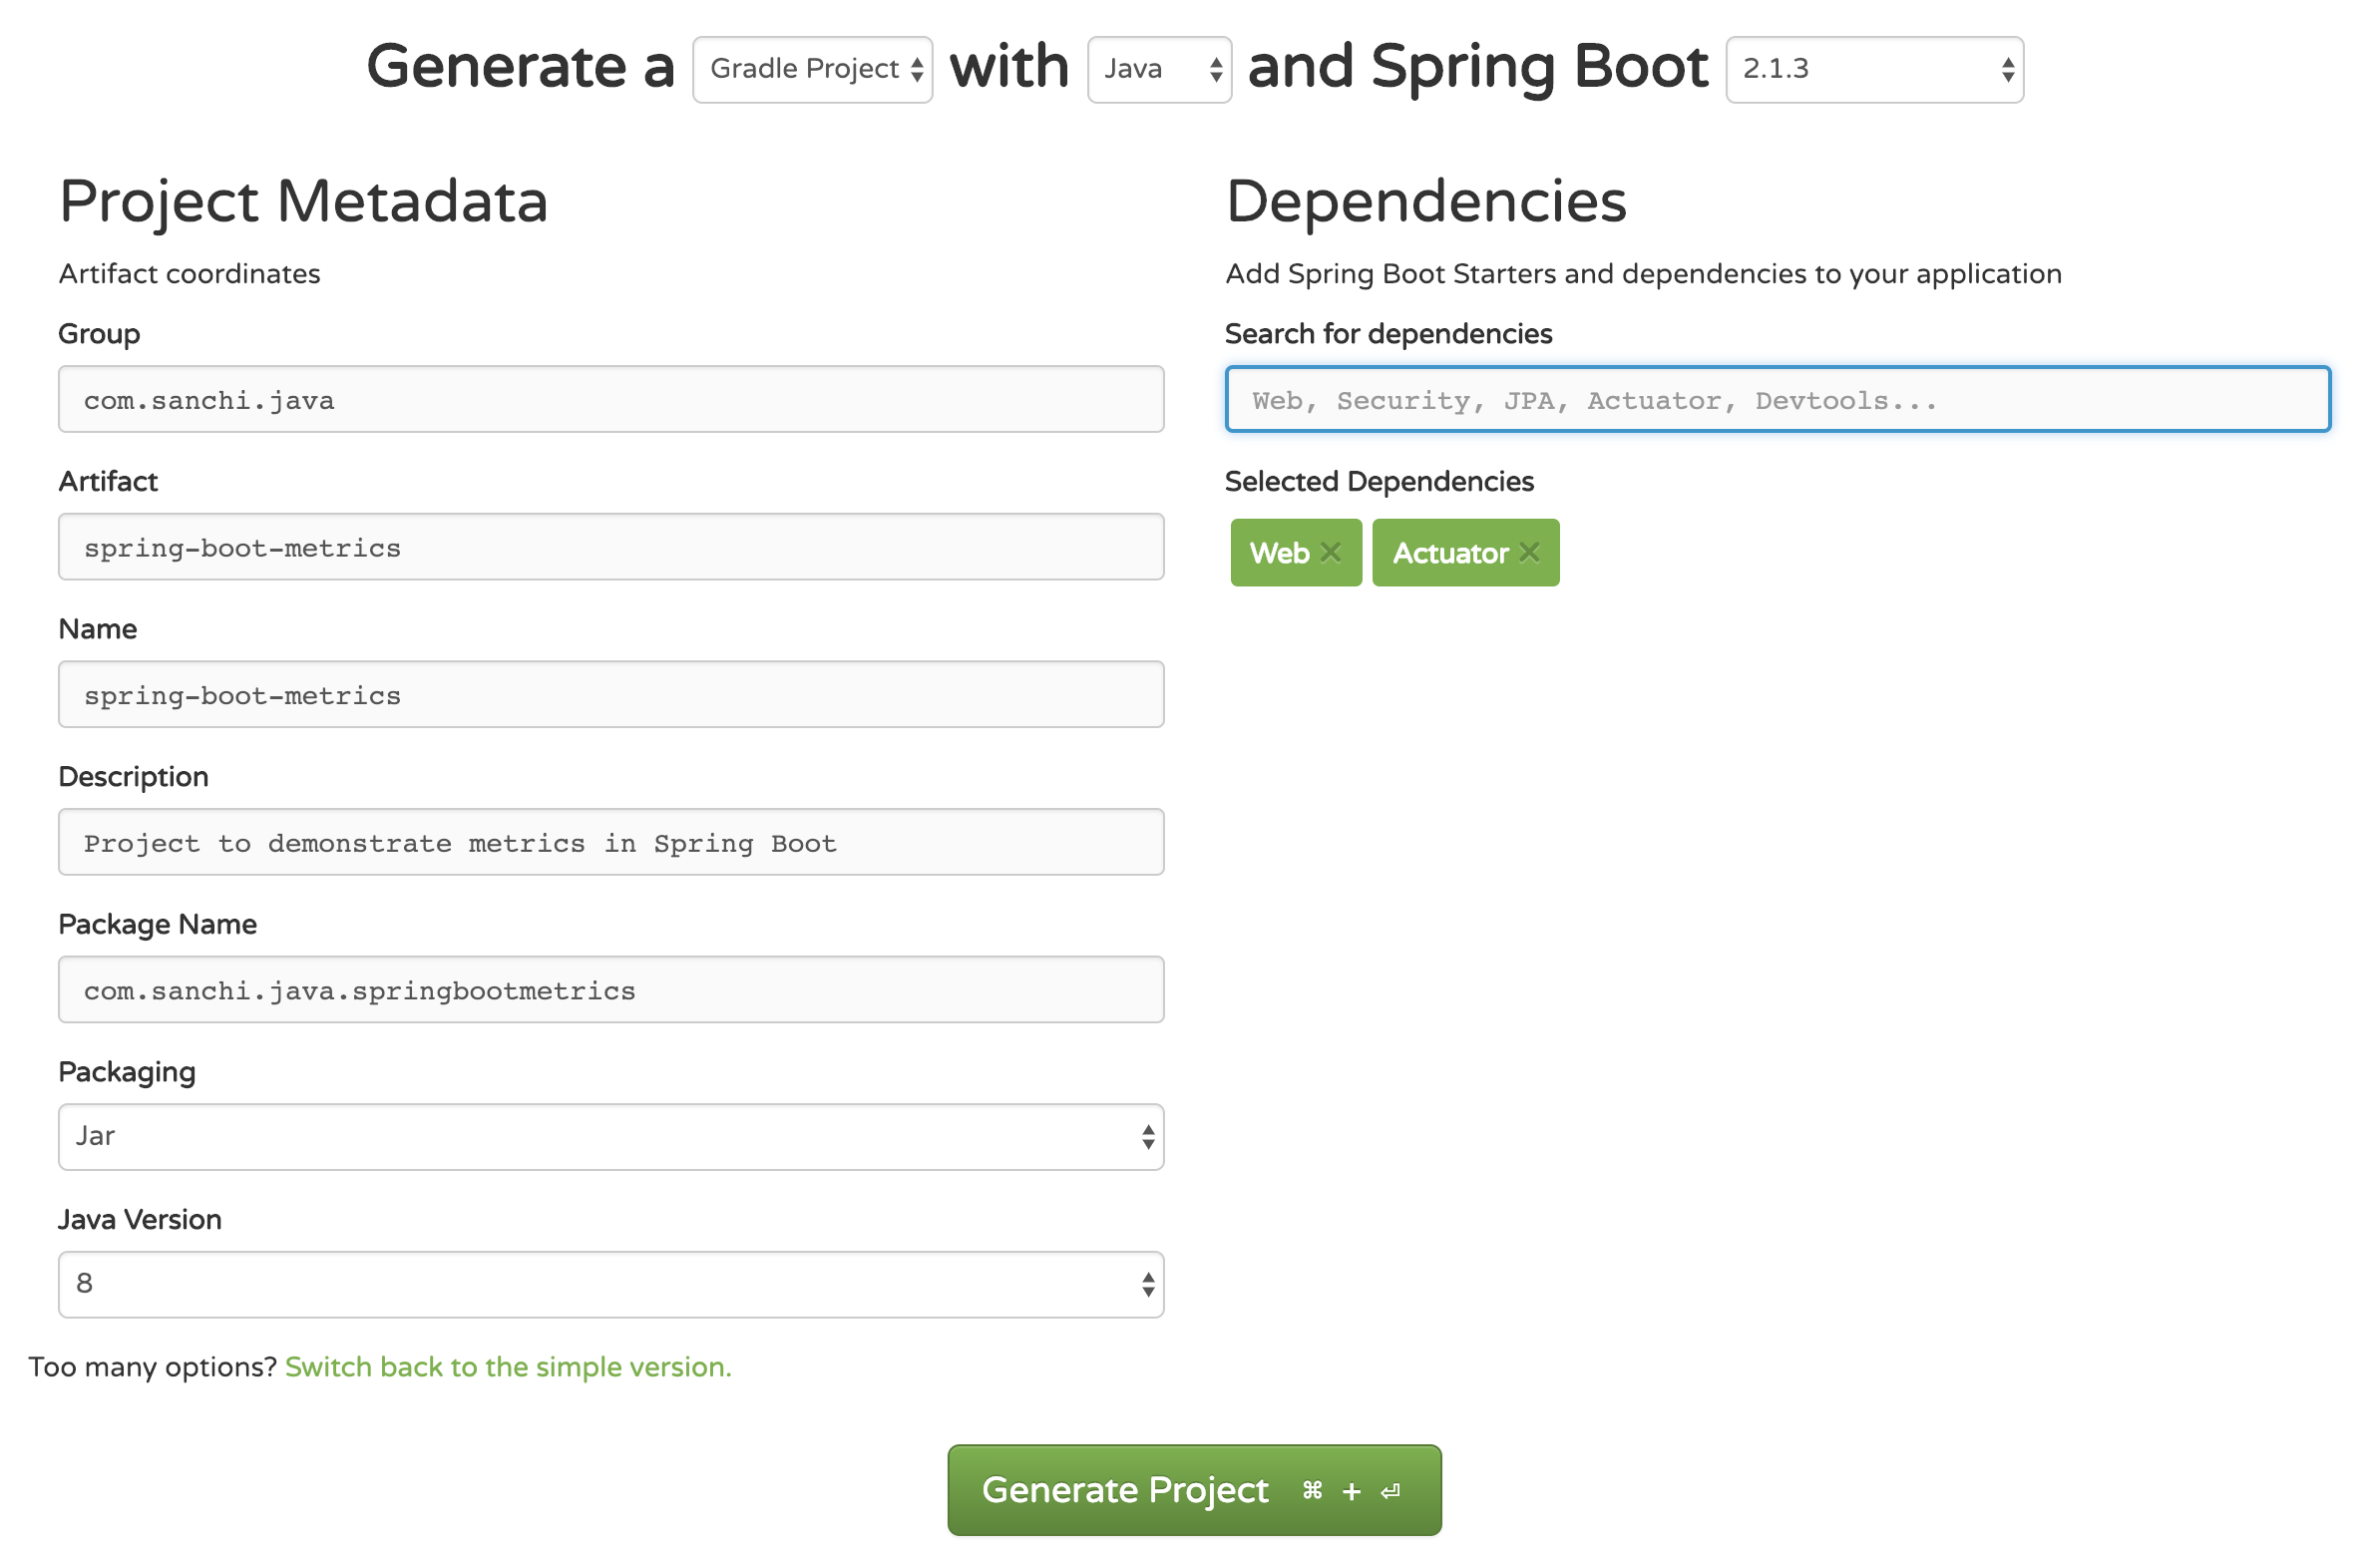
Let’s use Spring Initializr to bootstrap our application. Fill the form as shown below and click on Generate Project to download the project. Here I have included Spring MVC and Spring Actuator as dependencies.
Project Structure
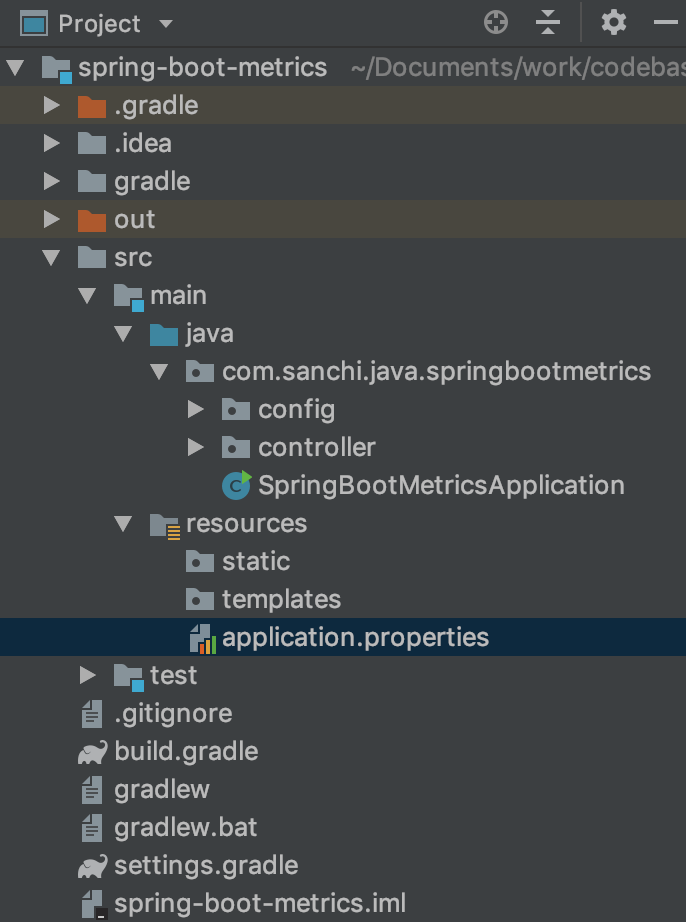
After your download is complete, unzip and open the project in your favorite IDE. I am using IntelliJ in this post.
Adding Micrometer Prometheus Registry
Spring Boot uses Micrometer, an application metric facade to integrate actuator metrics with external monitoring systems.
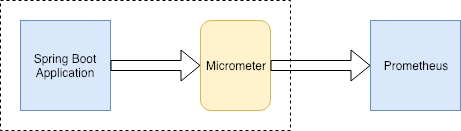
Micrometer provides registry for all the monitoring systems it supports. To integrate actuator with Prometheus, you will need to add the micrometer-registry-prometheus as runtime dependency.
dependencies {
  implementation 'org.springframework.boot:spring-boot-starter-actuator'
  runtime 'io.micrometer:micrometer-registry-prometheus'
  implementation 'org.springframework.boot:spring-boot-starter-web'
}
Once you add the above dependency, Spring Boot will automatically configure PrometheusMeterRegistry and a CollectorRegistry to collect and export metrics data in a format that can be scrapped by a Prometheus server.
Enabling Prometheus Endpoints
Prometheus is a polling monitoring system. It requires an endpoint from which it can scrape the metrics data at a configured interval. By default in Spring Boot Actuator only info and health endpoints are enabled. To enable prometheus endpoint add the following to your application.properties file.
management.endpoints.web.exposure.include=health,info,prometheusYou can verify the list of enabled metrics by visiting http://localhost:8080/actuator endpoint. After including the above, application metrics will be made available at http://localhost:8080/actuator/prometheus. In the next section you will learn how to configure Prometheus to scrape data from this endpoint.
Setup Prometheus using Docker
Downloading Prometheus
You can download the Prometheus docker image using docker pull command like shown below.
$ docker pull prom/prometheusOnce the image is downloaded, you can verify using docker image ls | grep prometheus
$ docker image ls | grep prometheus
prom/prometheus         latest              690f4cf8dee2        2 weeks ago         101MB
Prometheus Configuration
Now, we need to configure Prometheus to scrape metrics from our application’s prometheus endpoint.
For this create a new file called prometheus.yml with the following configurations:
# my global config
global:
  scrape_interval:     15s # Set the scrape interval to every 15 seconds. Default is every 1 minute.
  evaluation_interval: 15s # Evaluate rules every 15 seconds. The default is every 1 minute.
  # scrape_timeout is set to the global default (10s).

# Alertmanager configuration
alerting:
  alertmanagers:
  - static_configs:
    - targets:
      # - alertmanager:9093

# Load rules once and periodically evaluate them according to the global 'evaluation_interval'.
rule_files:
  # - "first_rules.yml"
  # - "second_rules.yml"

# A scrape configuration containing exactly one endpoint to scrape:
# Here it's Prometheus itself.
scrape_configs:
  # The job name is added as a label `job=<job_name>` to any timeseries scraped from this config.
  - job_name: 'prometheus'

    # metrics_path defaults to '/metrics'
    # scheme defaults to 'http'.

    static_configs:
    - targets: ['localhost:9090']

  - job_name: 'spring-actuator'
    metrics_path: '/actuator/prometheus'
    scrape_interval: 5s
    static_configs:
    - targets: ['HOST_IP:8080']
The most important thing to note in the above configuration is the spring-actuator job inside scrape_configs section.
This is where we define our application’s prometheus endpoint. The targets section contains the HOST and PORT of your Spring Boot application. Make sure to replace HOST_IP with your IP address of the machine. Note that, localhost won’t work here because your spring application is running outside the docker container. To obtain IP address on mac you can use the below command.
$ ifconfig| grep inetRunning Prometheus using Docker
Finally, let us start a Prometheus server using Docker. You can use the following command to start a Prometheus server in the background with our custom configuration.
$ docker run -d --name=prometheus -p 9090:32775 -v <PATH_TO_prometheus.yml_FILE>:/etc/prometheus/prometheus.yml prom/prometheus --config.file=/etc/prometheus/prometheus.ymlAfter running the above command, docker will start the Prometheus server inside a container.
$ docker container ls
CONTAINER ID        IMAGE                    COMMAND                  CREATED             STATUS              PORTS                     NAMES
040d1b7ace05        prom/prometheus:latest   "/bin/prometheus --c…"   8 hours ago         Up 5 hours
Metrics Visualization in Prometheus Dashboard
That’s it! You can now navigate to http://localhost:32775 to explore the Prometheus dashboard.
Following is a Prometheus graph for CPU Usage metrics collected by Micrometer in our application.

You can check out the official Prometheus documentation to learn more about Prometheus Query Expression.
Micrometer Registry Customization
In this section we will go a step forward and customize the default Micrometer’s MeterRegistry to suit our needs.
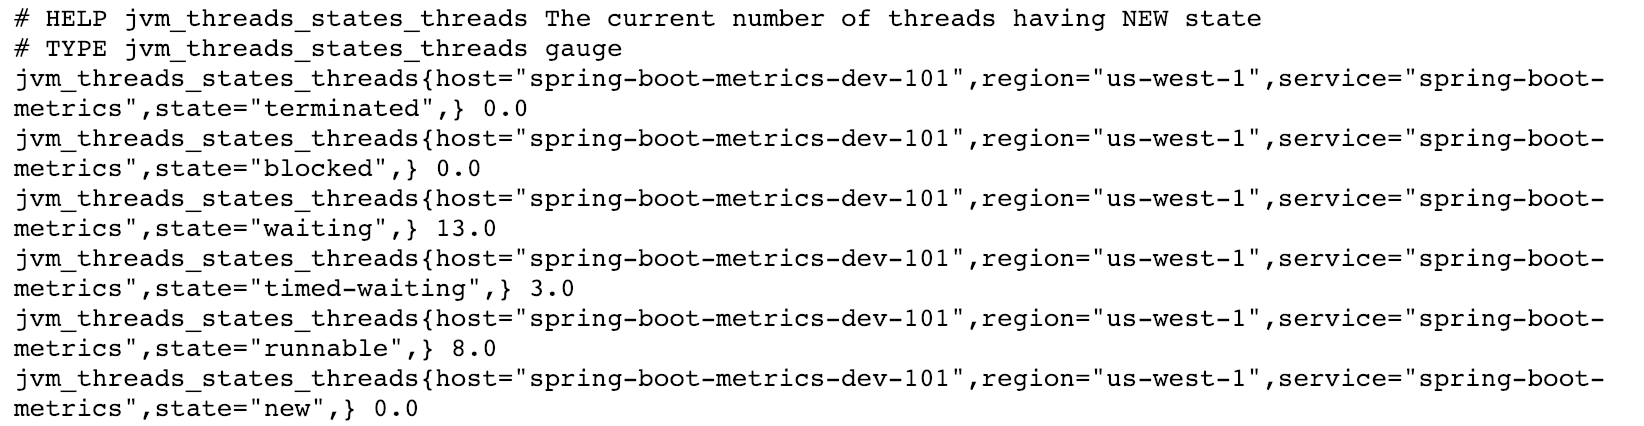
Let say you have N number of instances in your production distributed across different regional cluster. Now, requirement is to track application metrics by instance and region. The default setup doesn’t allow to differentiate between instances or hosts. However, Micrometer provides MeterRegistryCustomizer which can be used to customize the MeterRegistry and inject some common tags to help fulfill this requirement.
@Configuration
public class MetricsConfig {

  @Value("${host}")
  private String host;

  @Value("${service}")
  private String service;

  @Value("${region}")
  private String region;

  @Bean
  MeterRegistryCustomizer<MeterRegistry> meterRegistryCustomizer() {
    return registry -> registry.config()
        .commonTags("host", host,
            "service", service,
            "region", region)
        .meterFilter(MeterFilter.deny(id -> {
          String uri = id.getTag("uri");
          return uri != null && uri.startsWith("/actuator");
        }))
        .meterFilter(MeterFilter.deny(id -> {
          String uri = id.getTag("uri");
          return uri != null && uri.contains("favicon");
        }));
  }
}
The value of host, service and region can be overridden in the application.properties during deployment using a start script. So that all nodes can have unique values for these fields.
Now, we can run below query in Prometheus dashboard to look at the CPU usage of all nodes in a particular region.
system_cpu_usage{region="us-west-1"}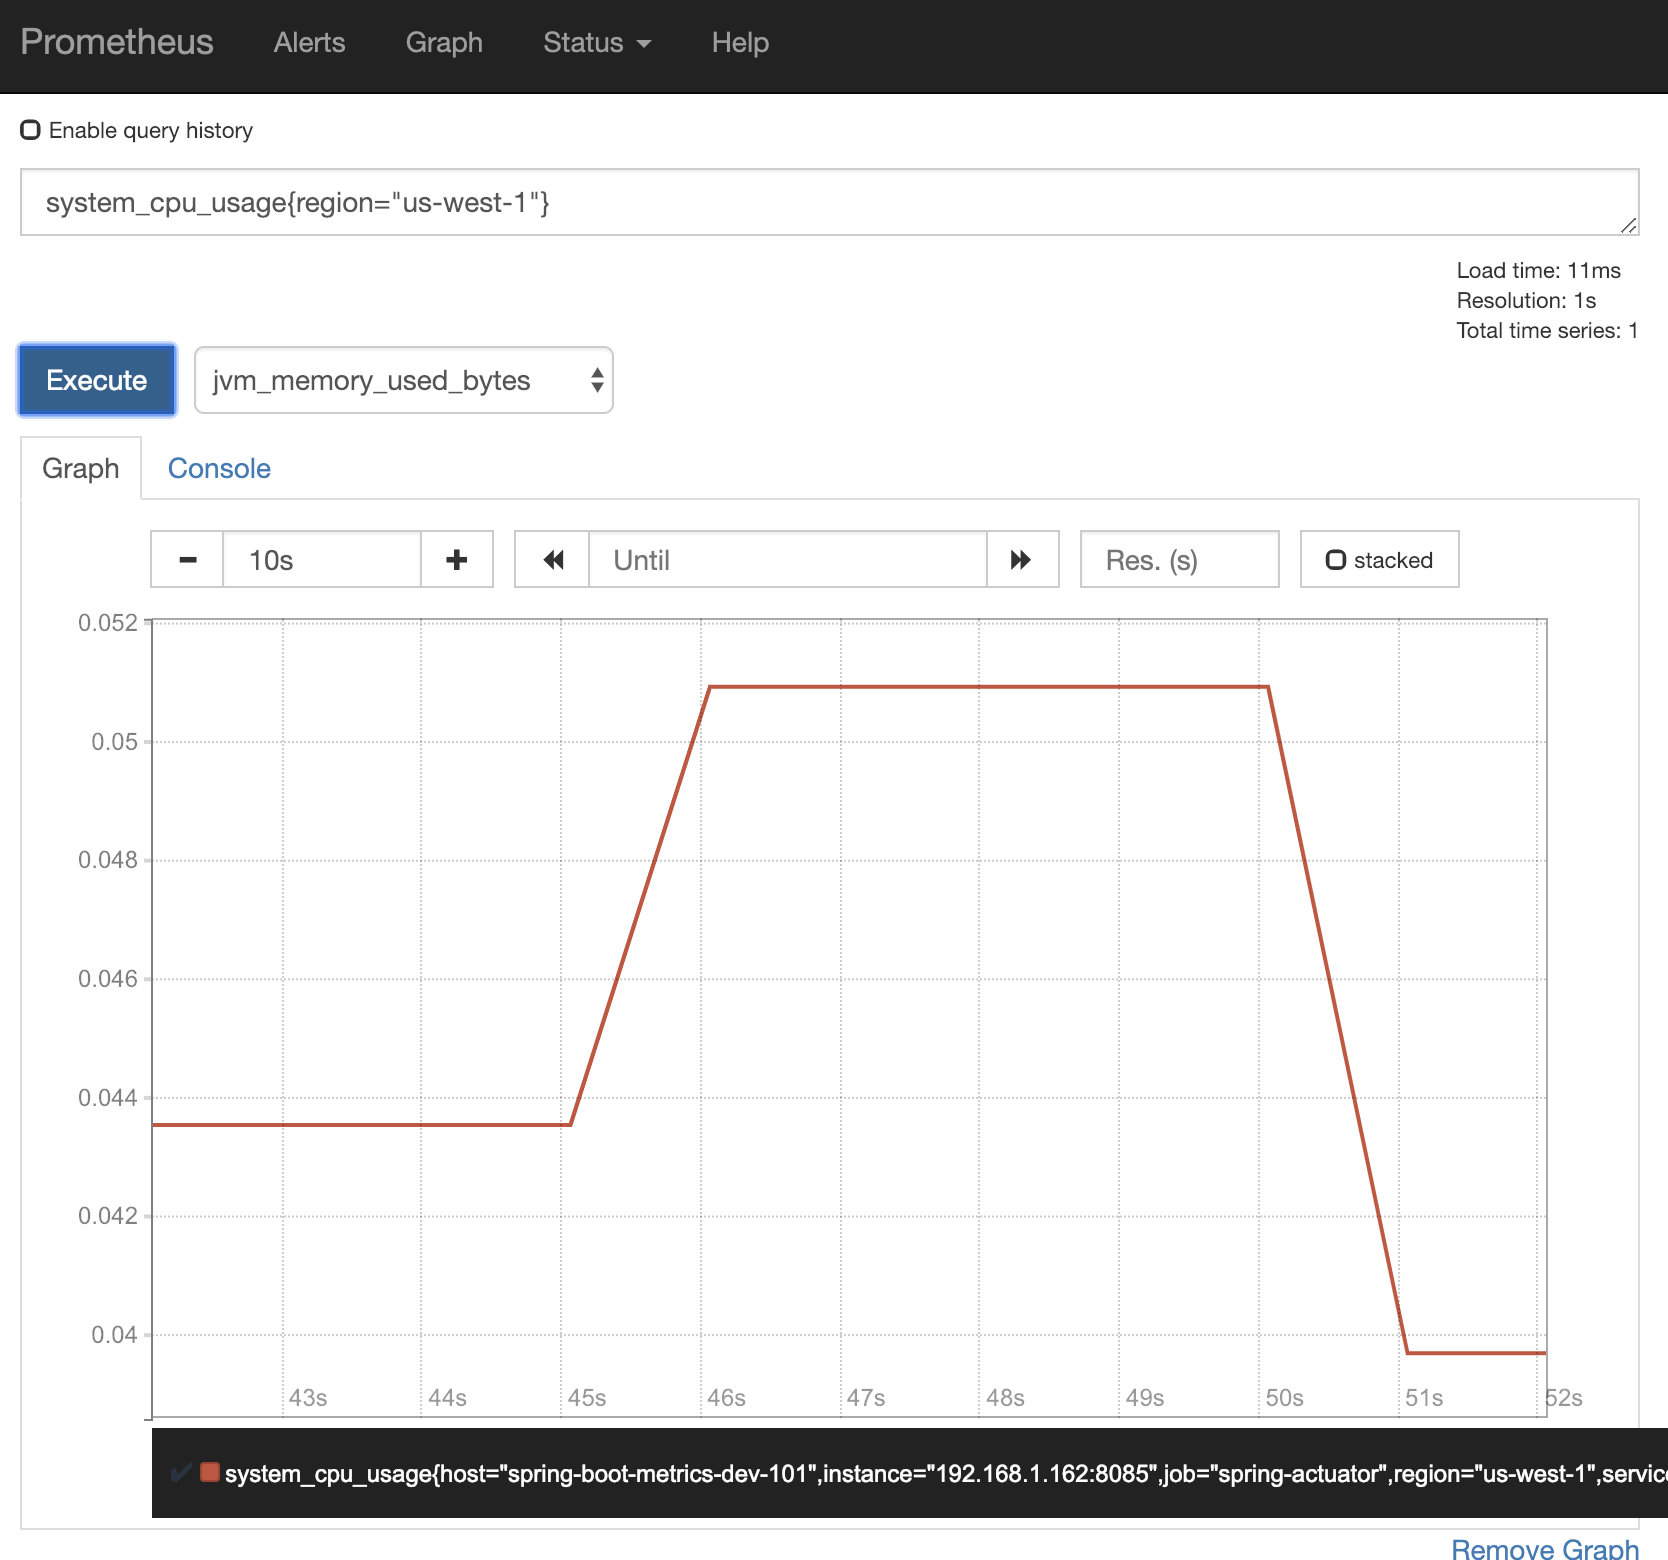
Custom Metrics
By default, Micrometer in Spring Boot provides below metrics via Actuator.
- JVM metrics: reports utilization of memory, garbage collection and thread
- CPU metrics
- File descriptor metrics
- Logback metrics: records the number of events logged to Logback at each log level
- Uptime metrics
- Tomcat metrics
- Spring integration metrics
- Spring MVC metrics
- Spring Webflux metrics
- RestTemplate metrics
However, in most of the production grade application, there is always a need to add custom metrics. Below code registers a Counter, that maintains the count of differnt type of messages received by the application.
@RestController
public class MyController {

  @Autowired
  MeterRegistry registry;

  @RequestMapping(value = "/message/{message}", method = RequestMethod.GET)
  public String getMessage(@PathVariable("message") String message) {

    // counter to count different types of messages received
    registry.counter("custom.metrics.message", "value", message).increment();

    return message;
  }
Source Code on Github