Health Check API in Spring Boot Application

Table of Content
- Introduction
- Pre-requisite
- Bootstrapping a Spring Boot Application with Actuator
- Enabling & Disabling Health Check Endpoints
- Exposing Health Check Endpoints
- Health Check in Detail
- Custom Health Indicator
- Tips & Tricks
Introduction
Spring Boot Actuator module helps you manage your Spring Boot application by providing production grade features out-of-box without having to implement these features yourself. Actuator is mainly used to expose operational information about the running application – health, metrics, info, dump, env, etc. All of these features can be accessed over both HTTP or JMX endpoints.
Pre-requisite
- Java 1.8 or newer
- IntelliJ or Eclipse IDE
Bootstrapping a Spring Boot Application with Actuator
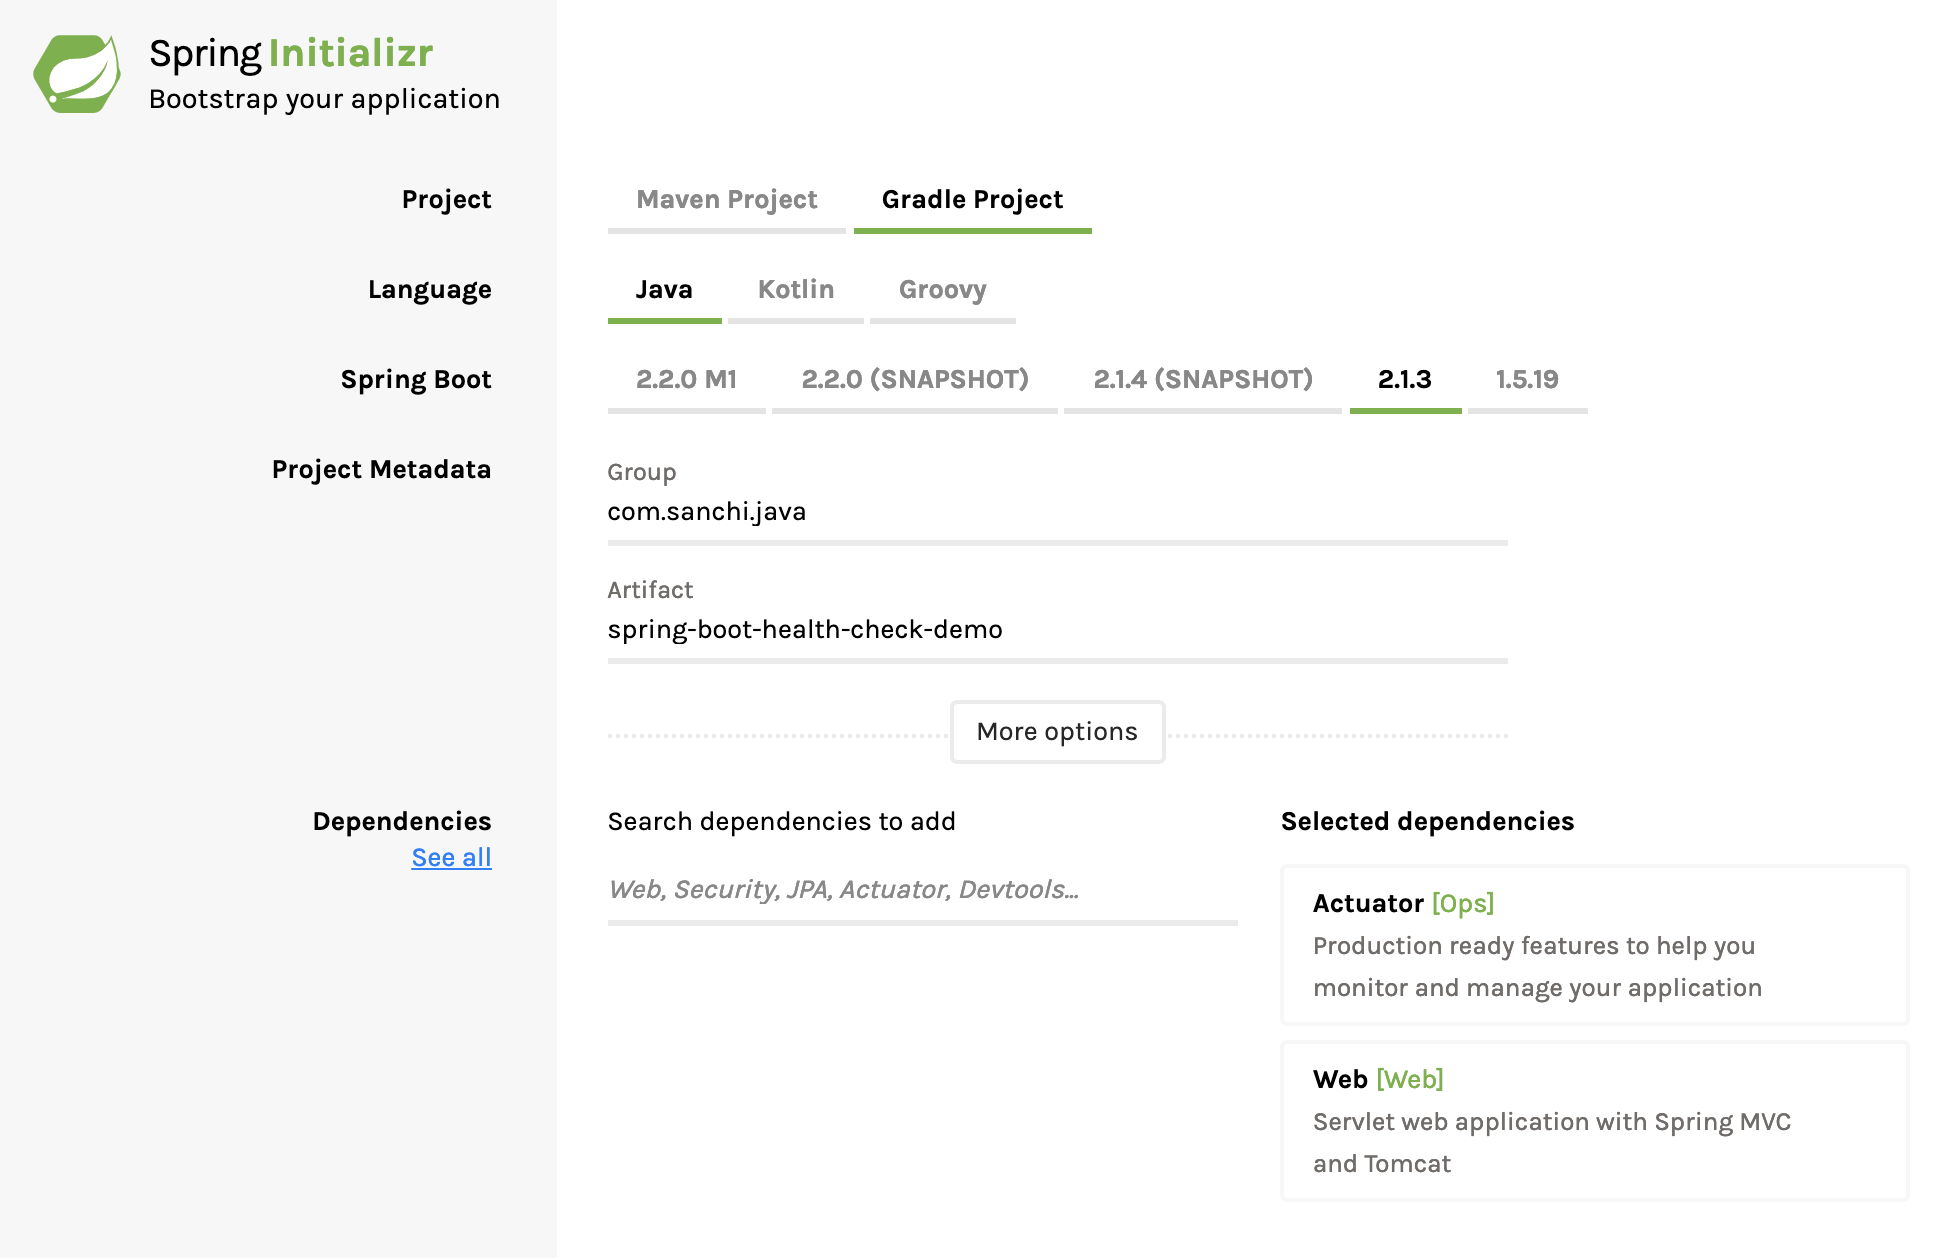
Let’s use Spring Initializr to bootstrap a Spring Boot application with Actuator as dependency. Fill the form as shown below and client Generate Project to download. Include Actuator and Web as dependencies.
Once the application has been download, open the project with your favorite IDE. This post uses IntelliJ as the IDE. Use below command to start your Spring Boot application.
$ ./gradlew bootRun...
2019-04-01 19:53:04.564 INFO 37986 --- [ main] o.s.web.context.ContextLoader : Root WebApplicationContext: initialization completed in 1167 ms
2019-04-01 19:53:04.994 INFO 37986 --- [ main] o.s.s.concurrent.ThreadPoolTaskExecutor : Initializing ExecutorService 'applicationTaskExecutor'
2019-04-01 19:53:05.208 INFO 37986 --- [ main] o.s.b.a.e.web.EndpointLinksResolver : Exposing 2 endpoint(s) beneath base path '/actuator'
2019-04-01 19:53:05.271 INFO 37986 --- [ main] o.s.b.w.embedded.tomcat.TomcatWebServer : Tomcat started on port(s): 8080 (http) with context path ''
2019-04-01 19:53:05.278 INFO 37986 --- [ main] j.s.SpringBootHealthCheckDemoApplication : Started SpringBootHealthCheckDemoApplication in 2.159 seconds (JVM running for 2.434)Your Spring Boot application will start within few seconds on HTTP Port 8080. Open http://localhost:8080/actuator in your browser. You should see an output like shown below.
{
  "self": {
    "href": "http://localhost:8080/actuator",
    "templated": false
  },
  "health": {
    "href": "http://localhost:8080/actuator/health",
    "templated": false
  },
  "health-component": {
    "href": "http://localhost:8080/actuator/health/{component}",
    "templated": true
  },
  "health-component-instance": {
    "href": "http://localhost:8080/actuator/health/{component}/{instance}",
    "templated": true
  },
  "info": {
    "href": "http://localhost:8080/actuator/info",
    "templated": false
  }
}
You must have noticed, /health endpoint already in the above response. i.e. because by default actuator provide /health and /info endpoints. Now let’s explore health endpoint by opening http://localhost:8080/actuator/health in the browser. You should see a response like below.
{
  "status": "UP"
}
The status will be UP as long as the application is healthy. It will show DOWN if the application gets unhealthy due to any issue like connectivity with the database or lack of disk space etc. UP, DOWN, OUT_OF_SERVICE and UNKNOWN are the possible values for a status. When your application starts its status changes from STARTING to UP or DOWN based on the health of the application.
Enabling & Disabling Health Check Endpoints
By default, all endpoints provided by Spring Boot Actuator are enabled except for the shutdown endpoint.
You can enable or disable an actuator endpoint by setting the property management.endpoint.<id>.enabled to true or false (where id is the identifier for the endpoint).
For example, to disable the health endpoint, add the following to your application.properties
management.endpoint.health.disabled=trueExposing Health Check Endpoints
By default, all the actuator endpoints are exposed over JMX but only the health and info endpoints are exposed over HTTP. However, you can use below application properties to alter the behavior.
Exposing actuator endpoints over HTTP
# Use "*" to expose all endpoints, or a comma-separated list to expose selected ones
management.endpoints.web.exposure.include=health,info
management.endpoints.web.exposure.exclude=
Exposing actuator endpoints over JMX
# Use "*" to expose all endpoints, or a comma-separated list to expose selected ones
management.endpoints.jmx.exposure.include=*
management.endpoints.jmx.exposure.exclude=
Health Check in Detail
Spring Boot Actuator’s health endpoint checks the health of an application by consolidating multiple health check indicators. Some of the predefined indicators are DataSourceHealthIndicator, DiskSpaceHealthIndicator, MongoHealthIndicator, RedisHealthIndicator, CassandraHealthIndicator etc.
For example, if you have a dependency with MongoDB, Spring Boot will use MongoHealthIndicator to compute the overall health of the application.
You can disable a health indicator using the following application property.
management.health.mongo.enabled=falseBy default, all these indicators are enabled and are used to compute overall health of the application. As of now the /health shows a simple status as UP or DOWN. However, in case of DOWN, it would be interesting to know which dependency(s) resulted into the overall status as `DOWN’. To get the complete details including the status of every health indicator that was checked as part of the health check-up process, add the following property in the application.properties.
# HEALTH ENDPOINT
management.endpoint.health.show-details=always
Once you have done that, /health endpoint would return a response as shown below. Which contains the status of DiskSpaceHealthIndicator.
{
  "status": "UP",
  "details": {
    "diskSpace": {
      "status": "UP",
      "details": {
        "total": 250685575168,
        "free": 188298530816,
        "threshold": 10485760
      }
    }
  }
}
Custom Health Indicator
So far we have seen, how to configure health endpoint using Spring Boot Actuator and the default information that it provides. Now let’s go one more level up. Let’s say that you have some custom dependency in your application, but Spring doesn’t provide any HealthIndicator for that dependency. In this case, Spring allows you to define your custom health indicator as well and the same will be used magically by Spring to compute overall health of the application.
You can create a custom health indicator by either implementing the interface HealthIndicator or extending the abstract class AbstractHealthIndicator.
Let’s use the later to create a custom health indicator.
@Component
public class CustomHealthIndicator extends AbstractHealthIndicator {

  @Override
  protected void doHealthCheck(Builder builder) throws Exception {

    // .. do some processing to check the health of your custom dependency

    builder
        .up()
        .withDetail("details", "My custom health indicator");

    // if you throw an exception, the status will be 'DOWN' with exception message.
  }
}
Once, you have added your custom health indicator and restarted you application, /health endpoint will start to show details of your custom health indicator as well. Note, this happens because you have enabled to show status in detail in the previous section.
{
  "status": "UP",
  "details": {
    "custom": {
      "status": "UP",
      "details": {
        "details": "My custom health indicator"
      }
    },
    "diskSpace": {
      "status": "UP",
      "details": {
        "total": 250685575168,
        "free": 188292669440,
        "threshold": 10485760
      }
    }
  }
}
Tips & Tricks
- While creating custom health indicator, class prefix is used as the name in /health response. For example, if your health indicator class name is
CustomHealthIndicator, thencustomwill be used to display information under /health endpoint.
Source Code on Github