Metrics Visualization With Grafana

Table of Content
What is Grafana ?
Grafana is an open platform for beautiful analytics and monitoring. It allows you to query, visualize, alert on and understand your metrics no matter where they are stored. You can create, explore and share dashboards with your team and foster a data driven culture.
Grafana supports over 30 open source and commercial data sources like Graphite, InfluxDb, Prometheus and ElasticSearch. The advantage with this is that you can create a single dashboard with metrics from multiple datasources.
Setup Grafana using Docker
Use the following command to download the official Docker image for Grafana.
$ docker pull grafana/grafanaOne the image is downloaded, you can verify using docker image ls | grep grafana
$ docker image ls | grep grafana
grafana/grafana         latest              d0454da13c84        5 weeks ago         240MB
Now, lets run Grafana using Docker. Use the following command to start a Grafana server.
docker run -d --name=grafana -p 3000:3000 grafana/grafanaYou can run docker container ls to see the list of Docker containers.
$ docker container ls
CONTAINER ID        IMAGE                    COMMAND                  CREATED             STATUS              PORTS                     NAMES
507e53ef730a        grafana/grafana:latest   "/run.sh"                About an hour ago   Up About an hour    0.0.0.0:3000->3000/tcp    grafana
040d1b7ace05        prom/prometheus:latest   "/bin/prometheus --c…"   6 days ago          Up About an hour    0.0.0.0:32768->9090/tcp   prometheus
You must have noticed that I have Prometheus server also running in a Docker container. That is because in this post we will be importing metrics from Prometheus for visualization. You can see my post Metric Collection in Spring Boot with Micrometer and Prometheus to setup Prometheus locally.
Thats it ! You can now navigate to http://localhost:3000 to explore the Grafana and log in with default username admin and password admin.
Importing Metrics from Prometheus
Before you visualize anything in Grafana, you will have to first configure a datasource. In this case we will configure Prometheus as our source of metrics.
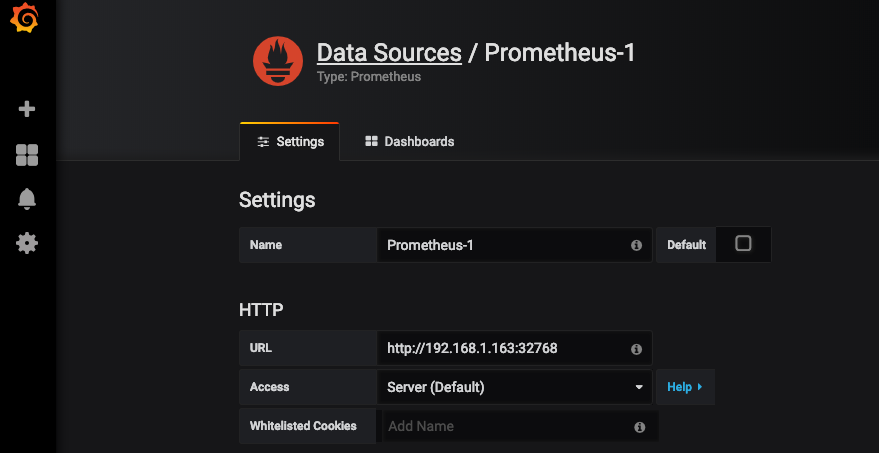
As you can see, you will have to provide the Prometheus endpoint in the URL section. Note that, specifying localhost does not work. You will have to provide the actual IP followed by the port number.
Metrics Visualization
Now that you have configured a datasource, it’s time to get creative and build a dashboard to monitor your metrics. Follow the steps below to setup your first graph on Grafana.
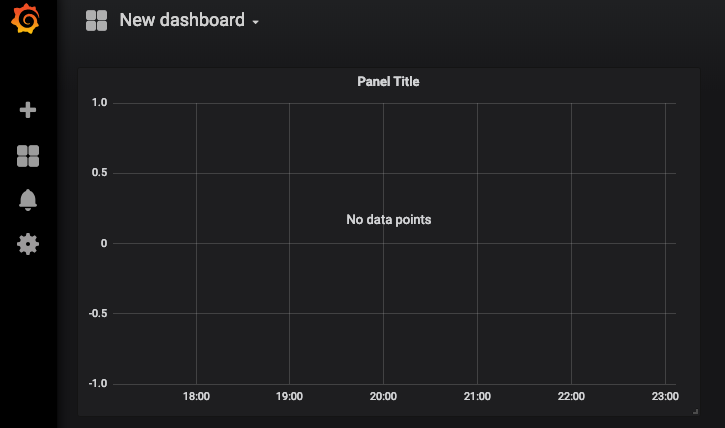
Create a new dashboard
Click on the + sign on the left sidebar to create a new dashboard.
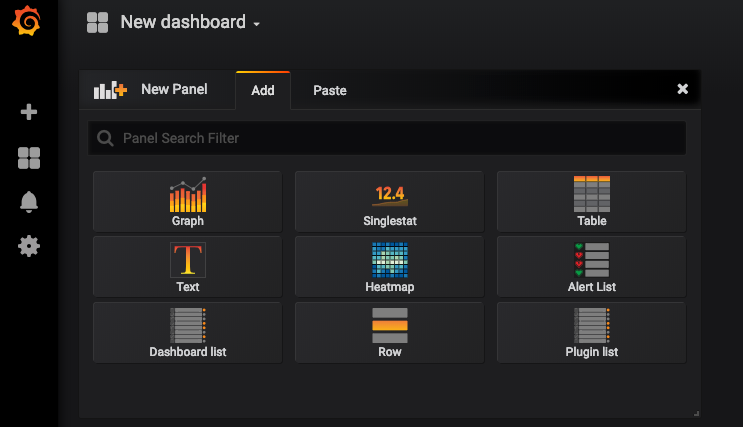
Select a panel type
Select the type Graph to plot a Line chart.
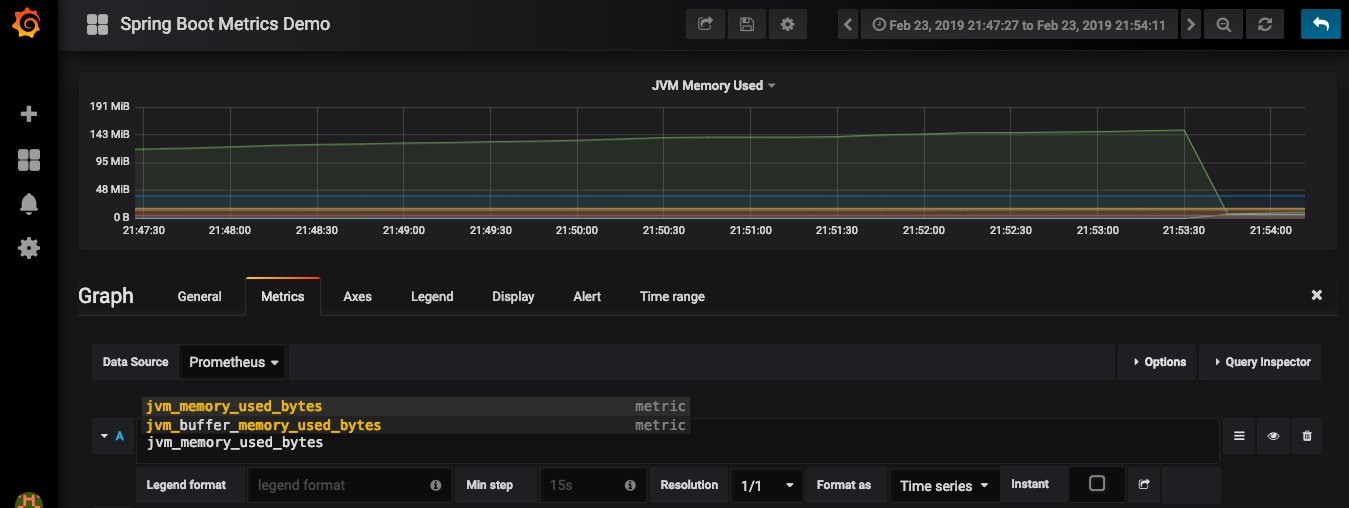
Add a Prometheus query expression
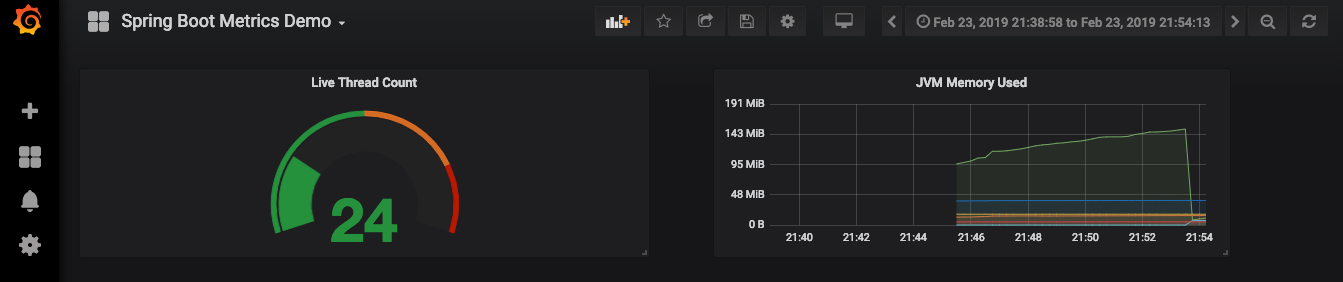
Now let’s add a query expression to pull data for metrics jvm_memory_used_bytes.
Similarly, you can add more panels as per your need and create a beautiful dashboard that help you and your support team to analyze and debug an application.